Introducing Our New Visual Editor: Diagrams for Everyone in Confluence!
September 23, 2024
James Bridge
We’re thrilled to announce the launch of a new feature in our Confluence app that takes diagramming to the next level: a visual editor that makes it easier for everyone—not just technical users—to create, share, and embed diagrams directly into Confluence pages - give this page a read to check out all the new features
Introduction
With the new Capable Visual Editor, creating diagrams is now as simple as drag-and-drop, allowing users of all skill levels to collaborate and present ideas visually.
The visual editor has powerful features such as:
- 🔗 Linkable objects
- 🧲 Magnetic arrows
- ✍️ Dynamic annotation
Now, everyone can contribute to creating clear and impactful diagrams directly within Confluence, fostering more inclusive and efficient collaboration. Whether you're a project manager, designer, or developer, you can now create professional-quality diagrams in Confluence without needing to write code.
.webp)
Easy drag and drop components
The new visual editor in Confluence is designed to be both intuitive and powerful. It offers a rich library of pre-built visual elements that make your diagrams clearer, more engaging, and quicker to create. With these ready-made components, you can easily enhance the visual appeal of your diagrams without the need to manually draw elements, saving you time while improving clarity. No more searching for the right icons or struggling to find suitable templates—the visual editor has everything you need built in.
A quick demonstration of the drag and drop editor with the libraries shown.
Use cases for your Confluence pages
The visual editor opens up a world of possibilities, making it easier for teams to work together within Confluence. Here are just a few ways you can use the new feature:

Whiteboarding in Confluence
Brainstorm and collaborate directly on Confluence pages using the visual editor as a virtual whiteboard. Use it to flesh out ideas, design workflows, or visualize team processes during meetings.
This diagram represents a structured workflow for managing system changes, involving roles that submit, review, and approve requests.
.webp)
Whiteboarding for product and web development
Create and embed interactive wireframes within your Confluence pages, helping product managers, designers, and developers align on UI designs. Templates can be shared across Confluence spaces, ensuring consistency and saving time for everyone.
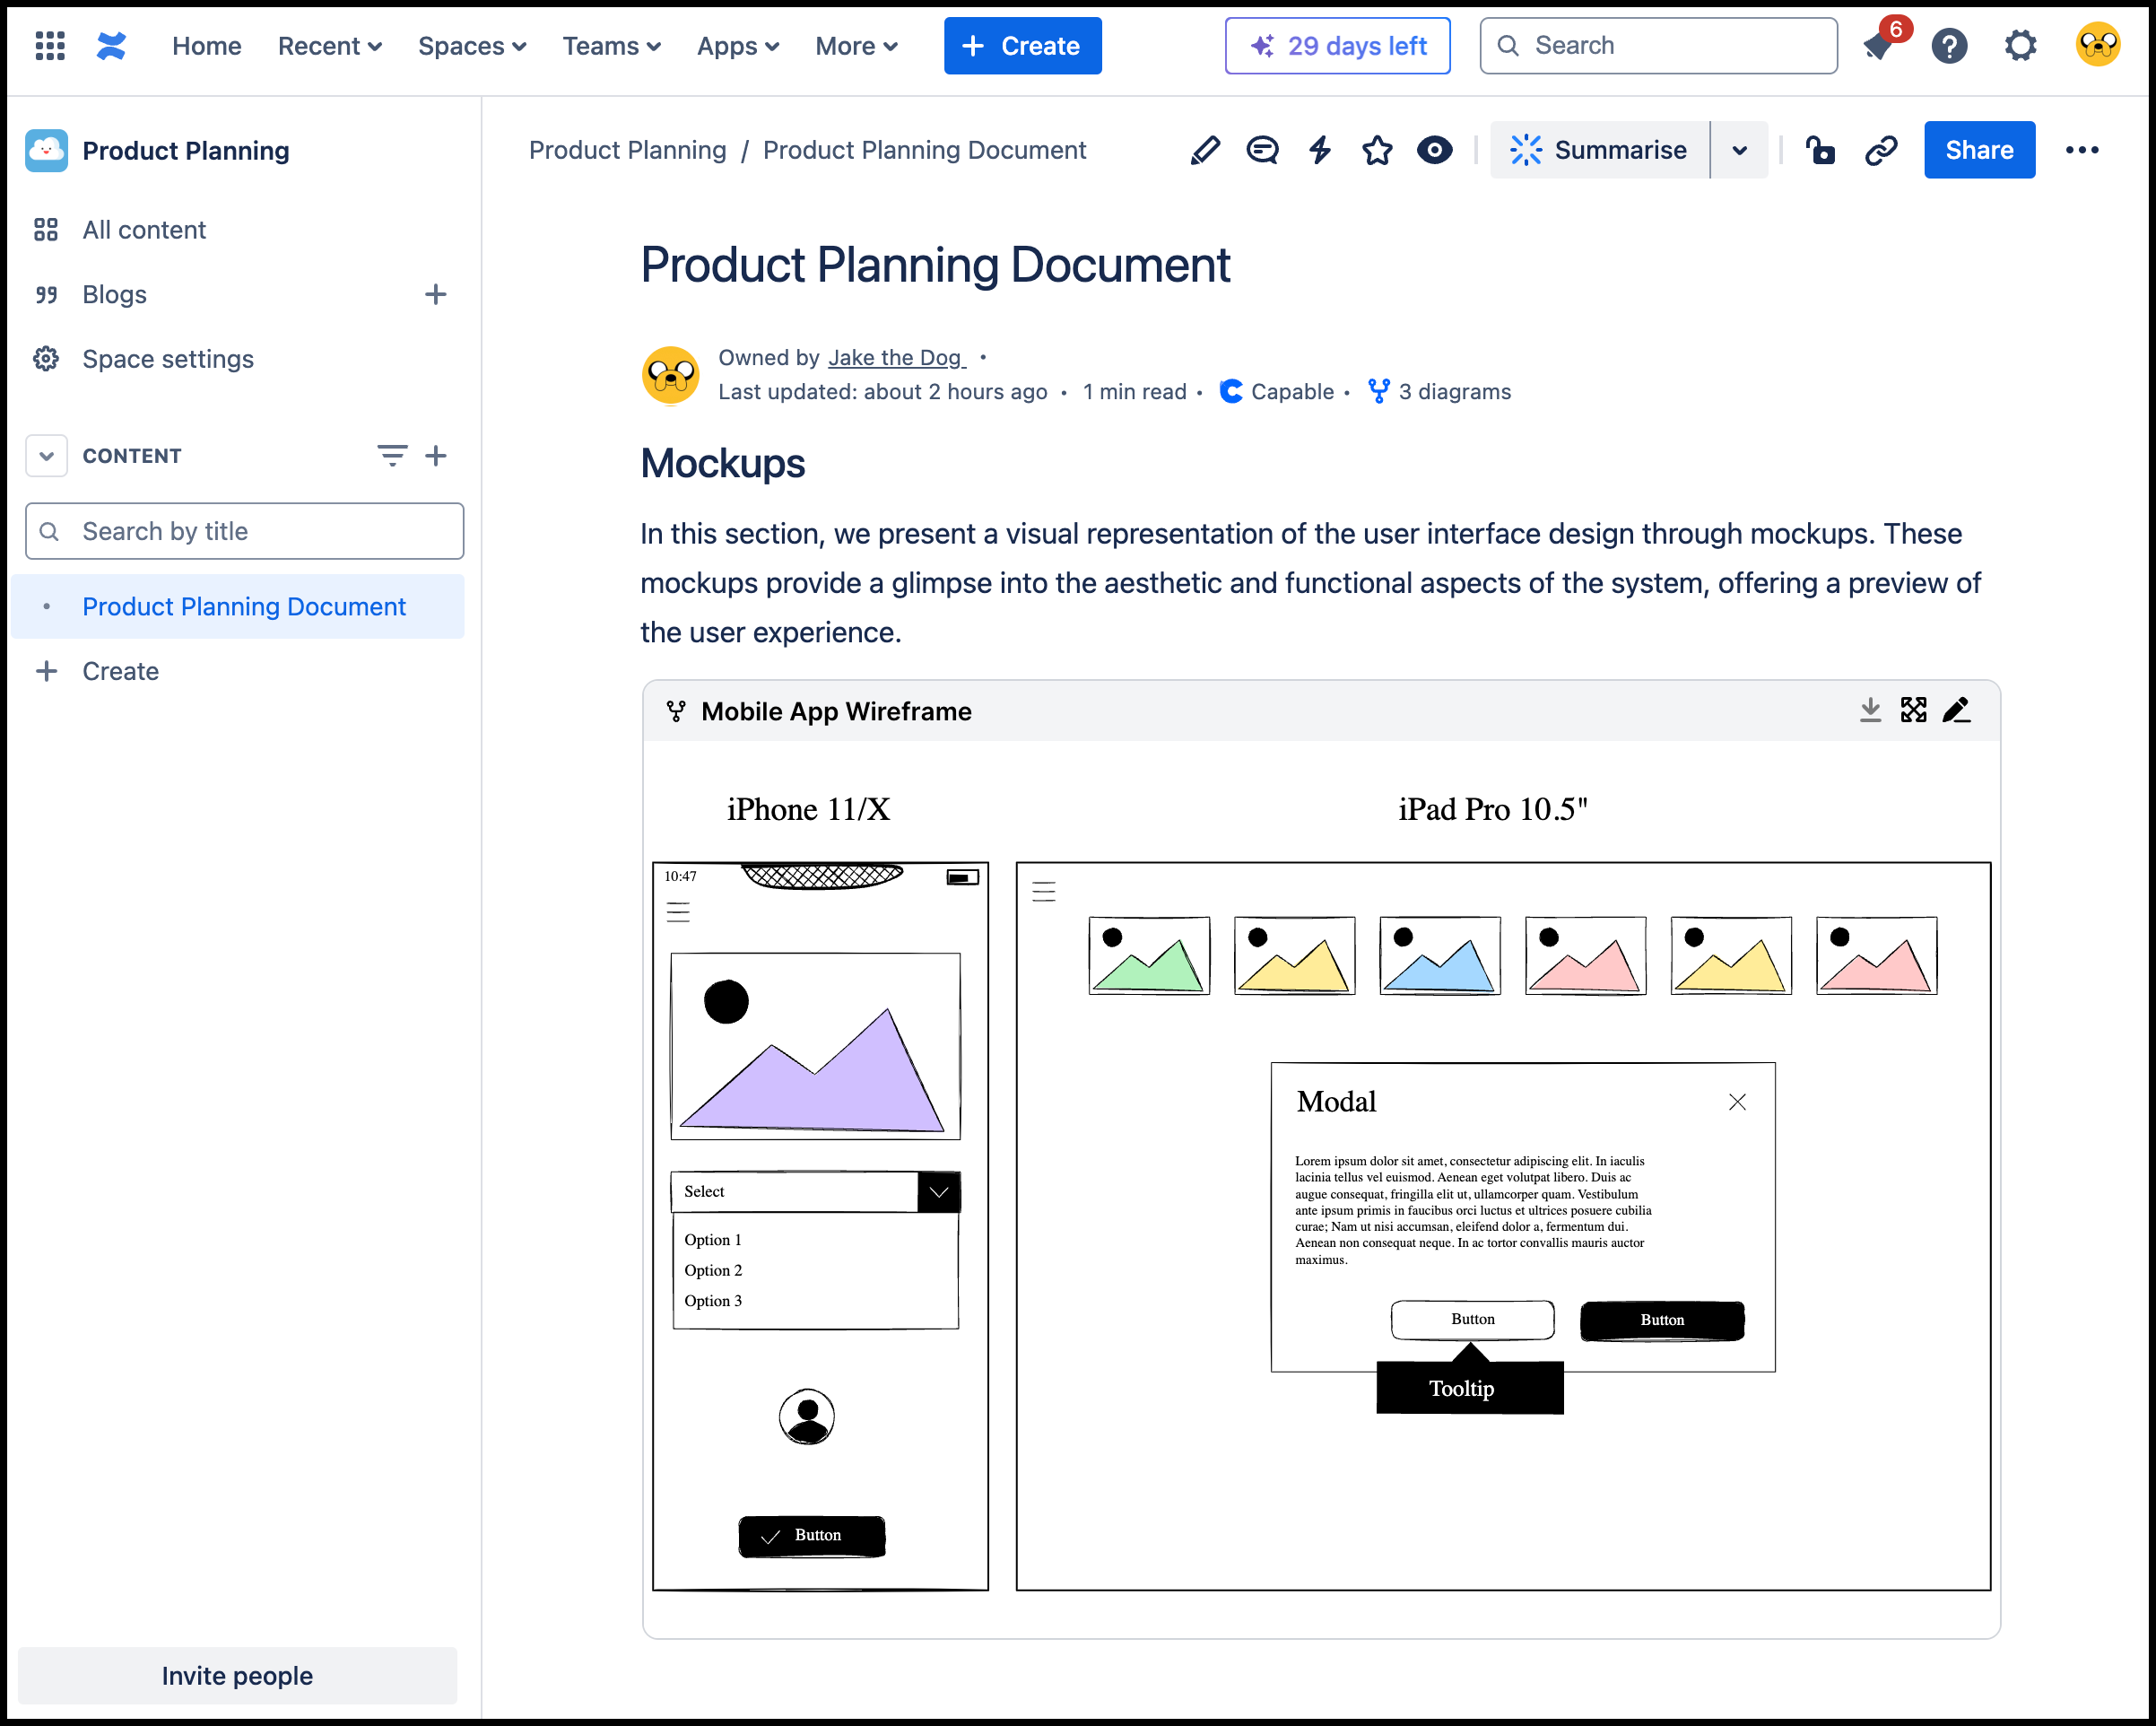
Here’s a visual representation of the user interface design through mockups.
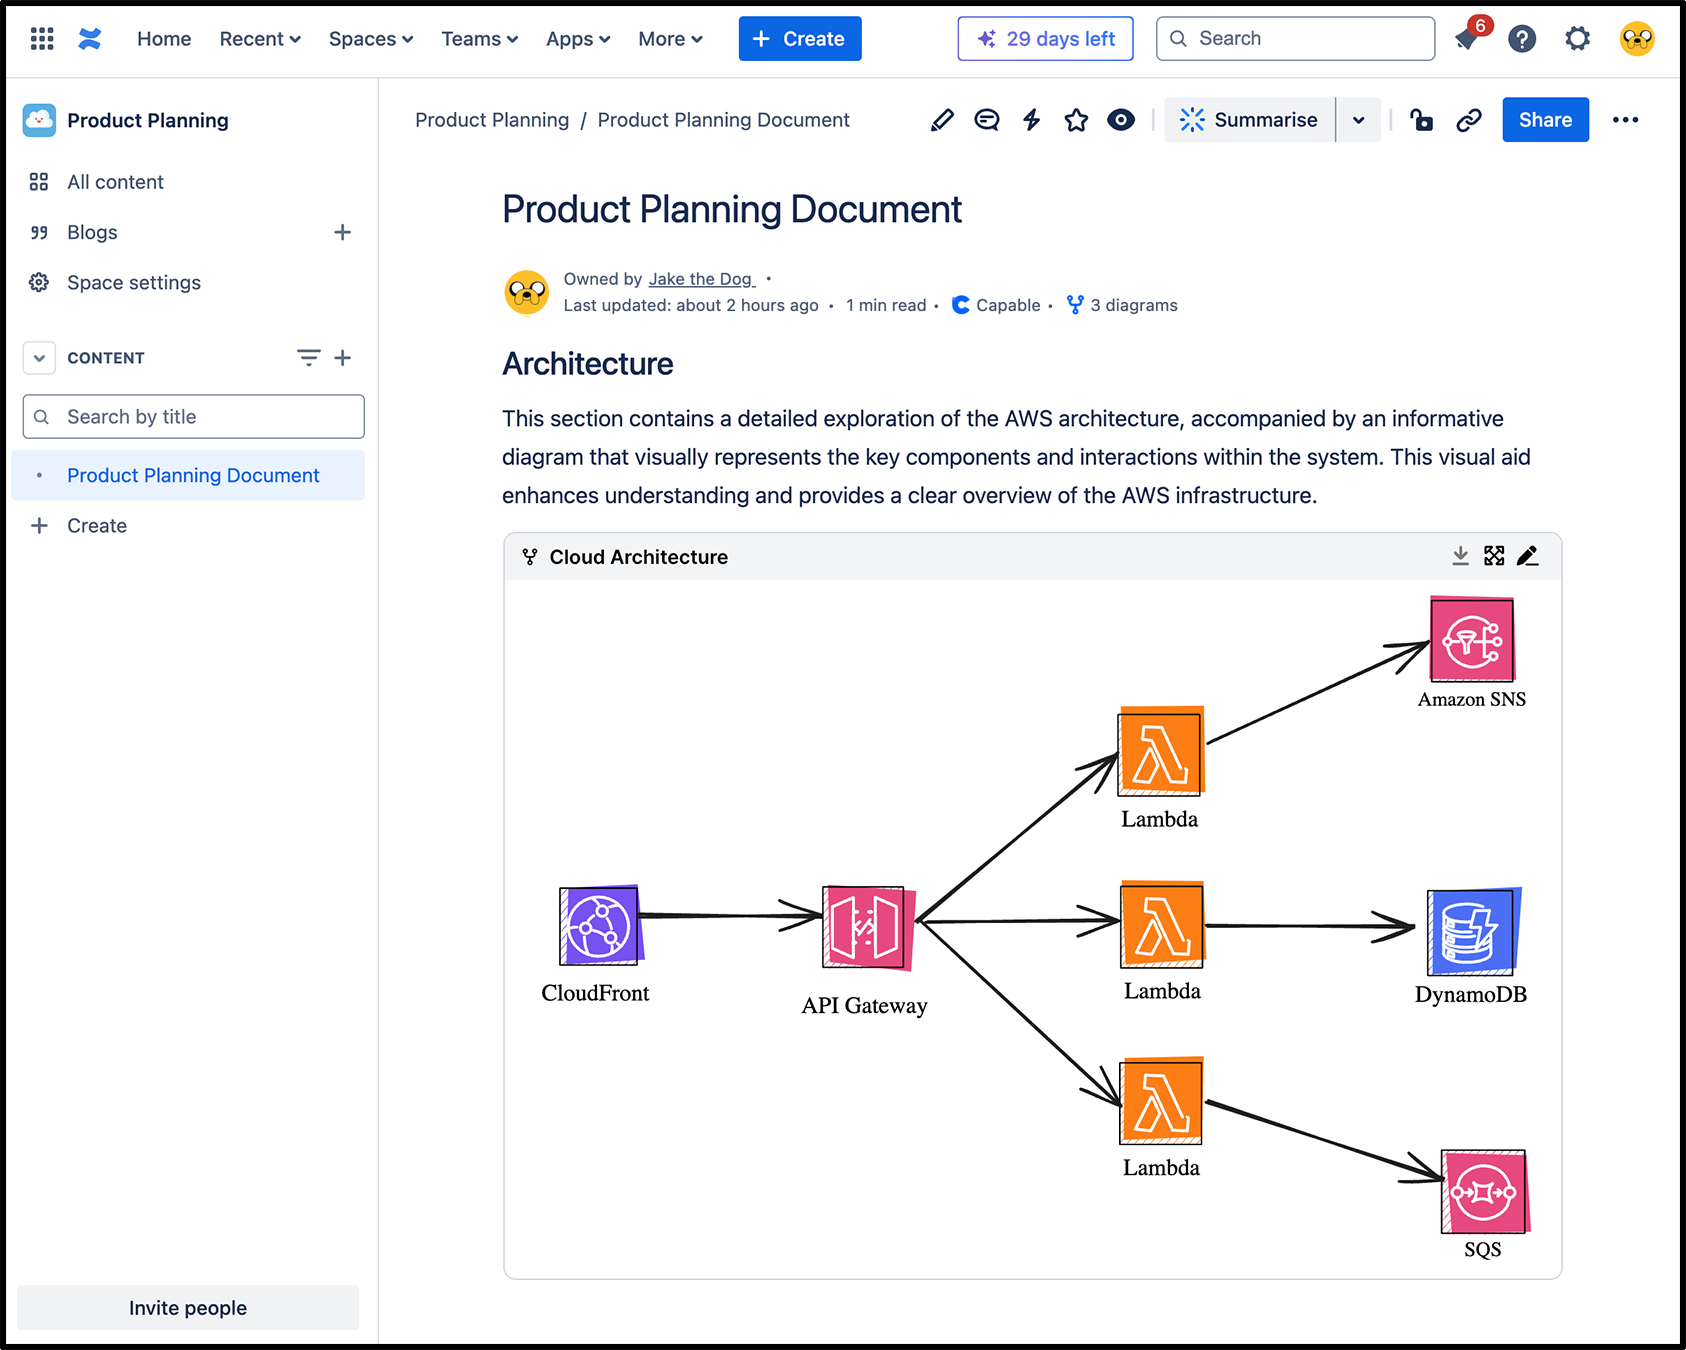
Cloud architecture diagrams
Take advantage of the extensive AWS and Azure icon libraries to create cloud architecture diagrams directly in Confluence. Embed these into technical documentation or presentations to keep all stakeholders on the same page.
User journey maps
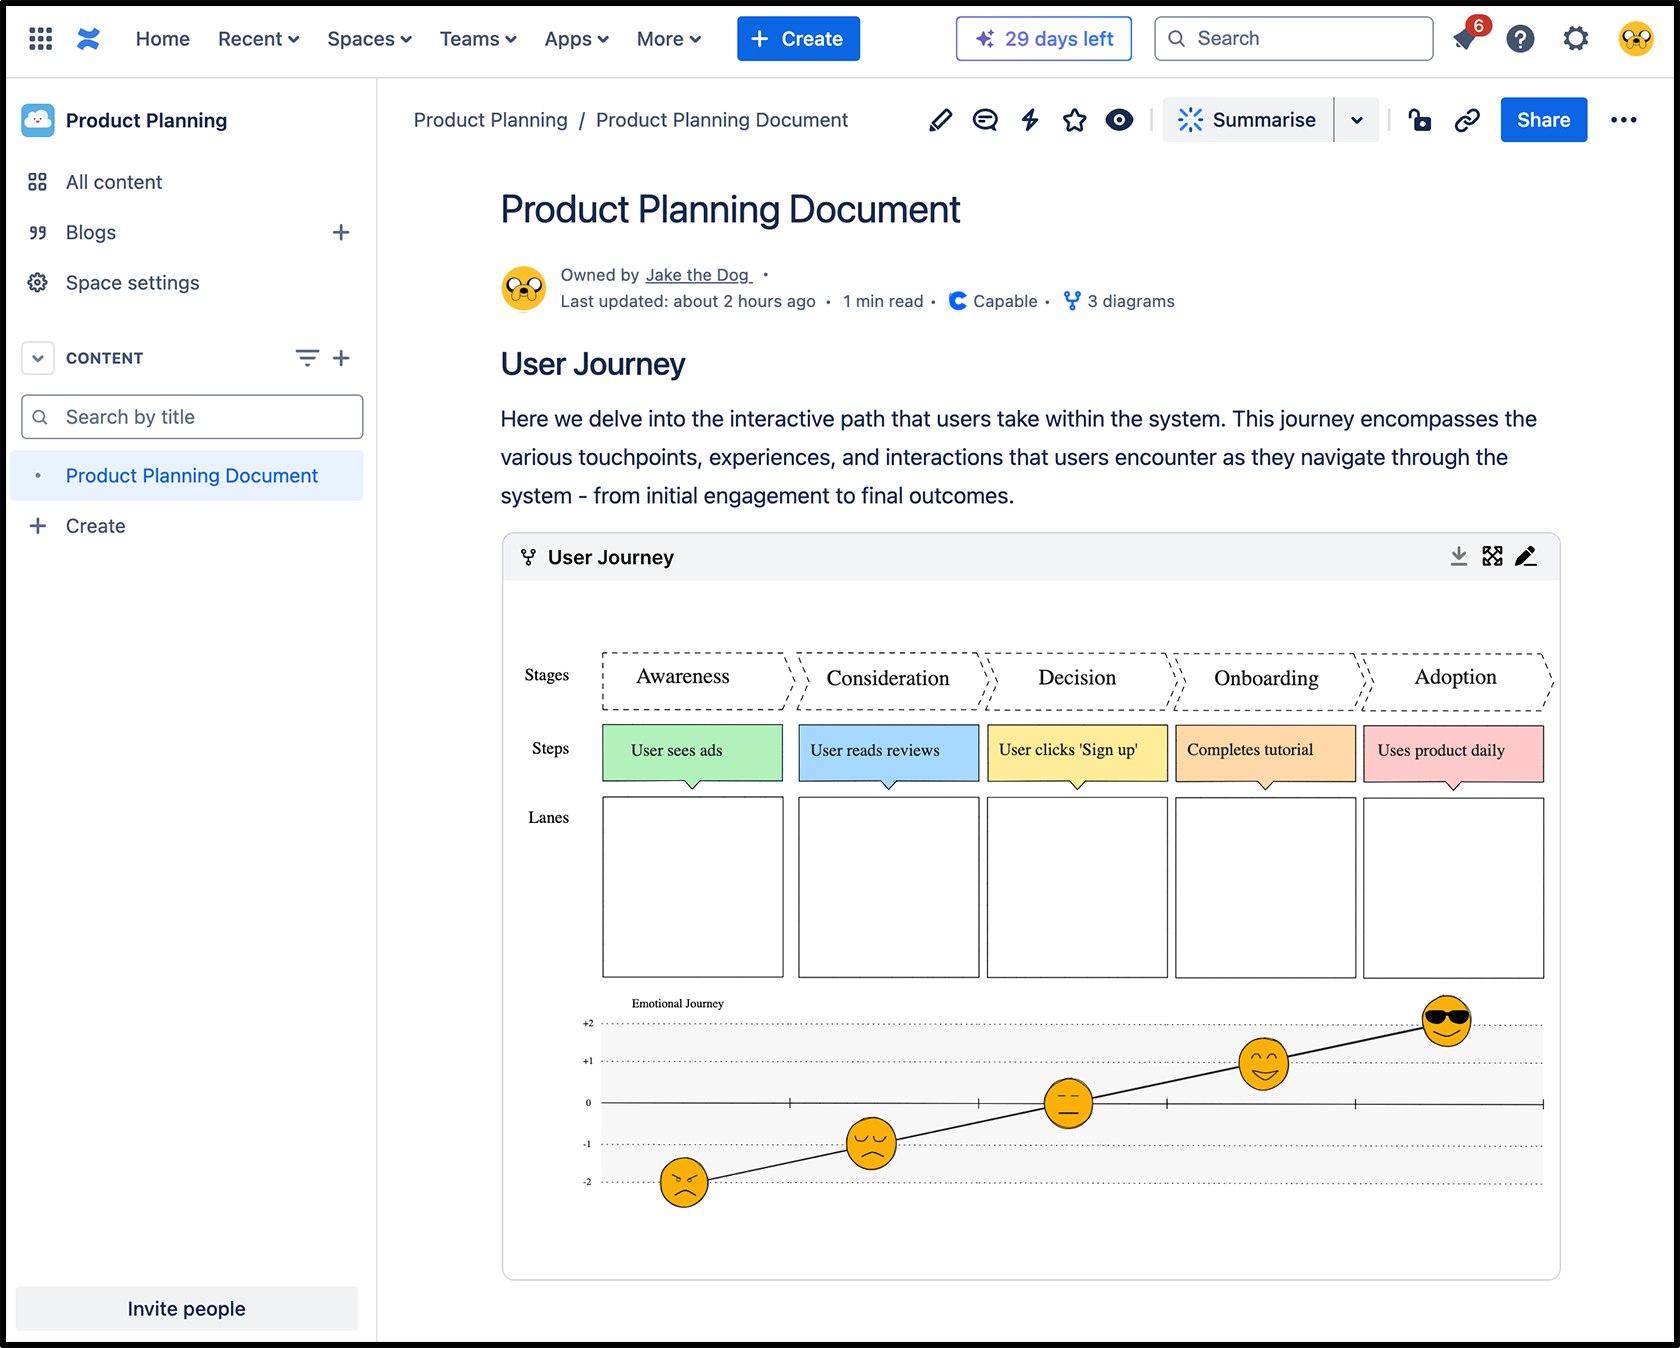
Use the visual editor to build customer journey maps that illustrate key touchpoints, pain points, and user interactions, and embed them into Confluence pages for easy sharing across teams.
Here we explore the user’s journey through the system, highlighting the key touchpoints, interactions, and experiences they encounter along the way.
Our favorite libraries
One of the biggest advantages of the new visual editor is its rich library support. A library is a collection of pre-made components, shapes, or objects that users can easily import and reuse in the Diagram. We have 211 libraries in our Diagram feature and this number is only growing.
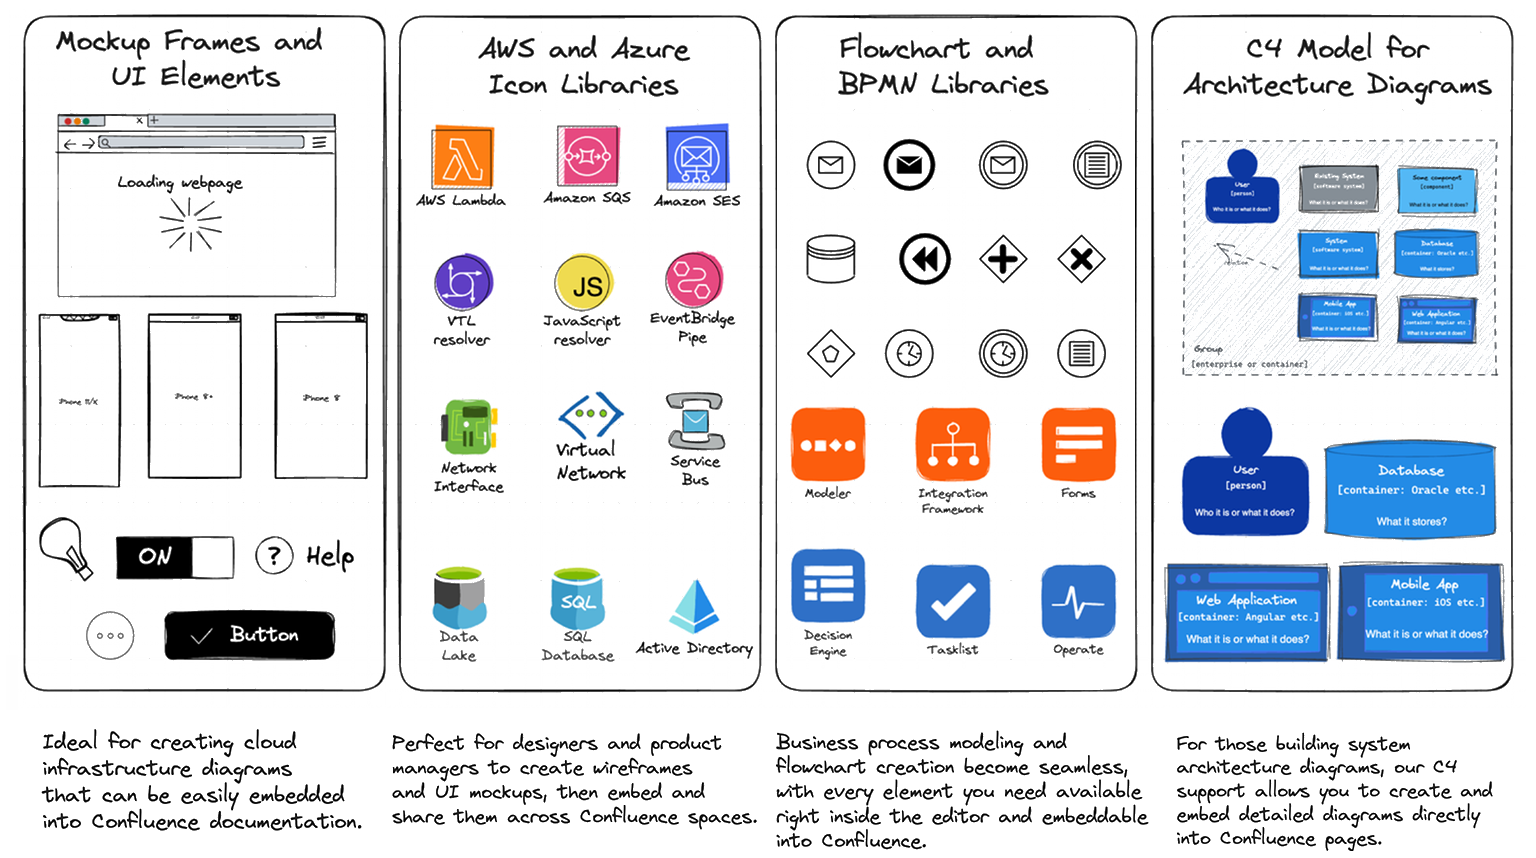
These libraries are built to save you time and ensure that you have everything you need at your fingertips, enhancing your team’s productivity while working within Confluence. You can also create your own library, allowing you and your team to add custom, branded icons directly into your diagrams.
Need advanced diagrams? Use the text editor!
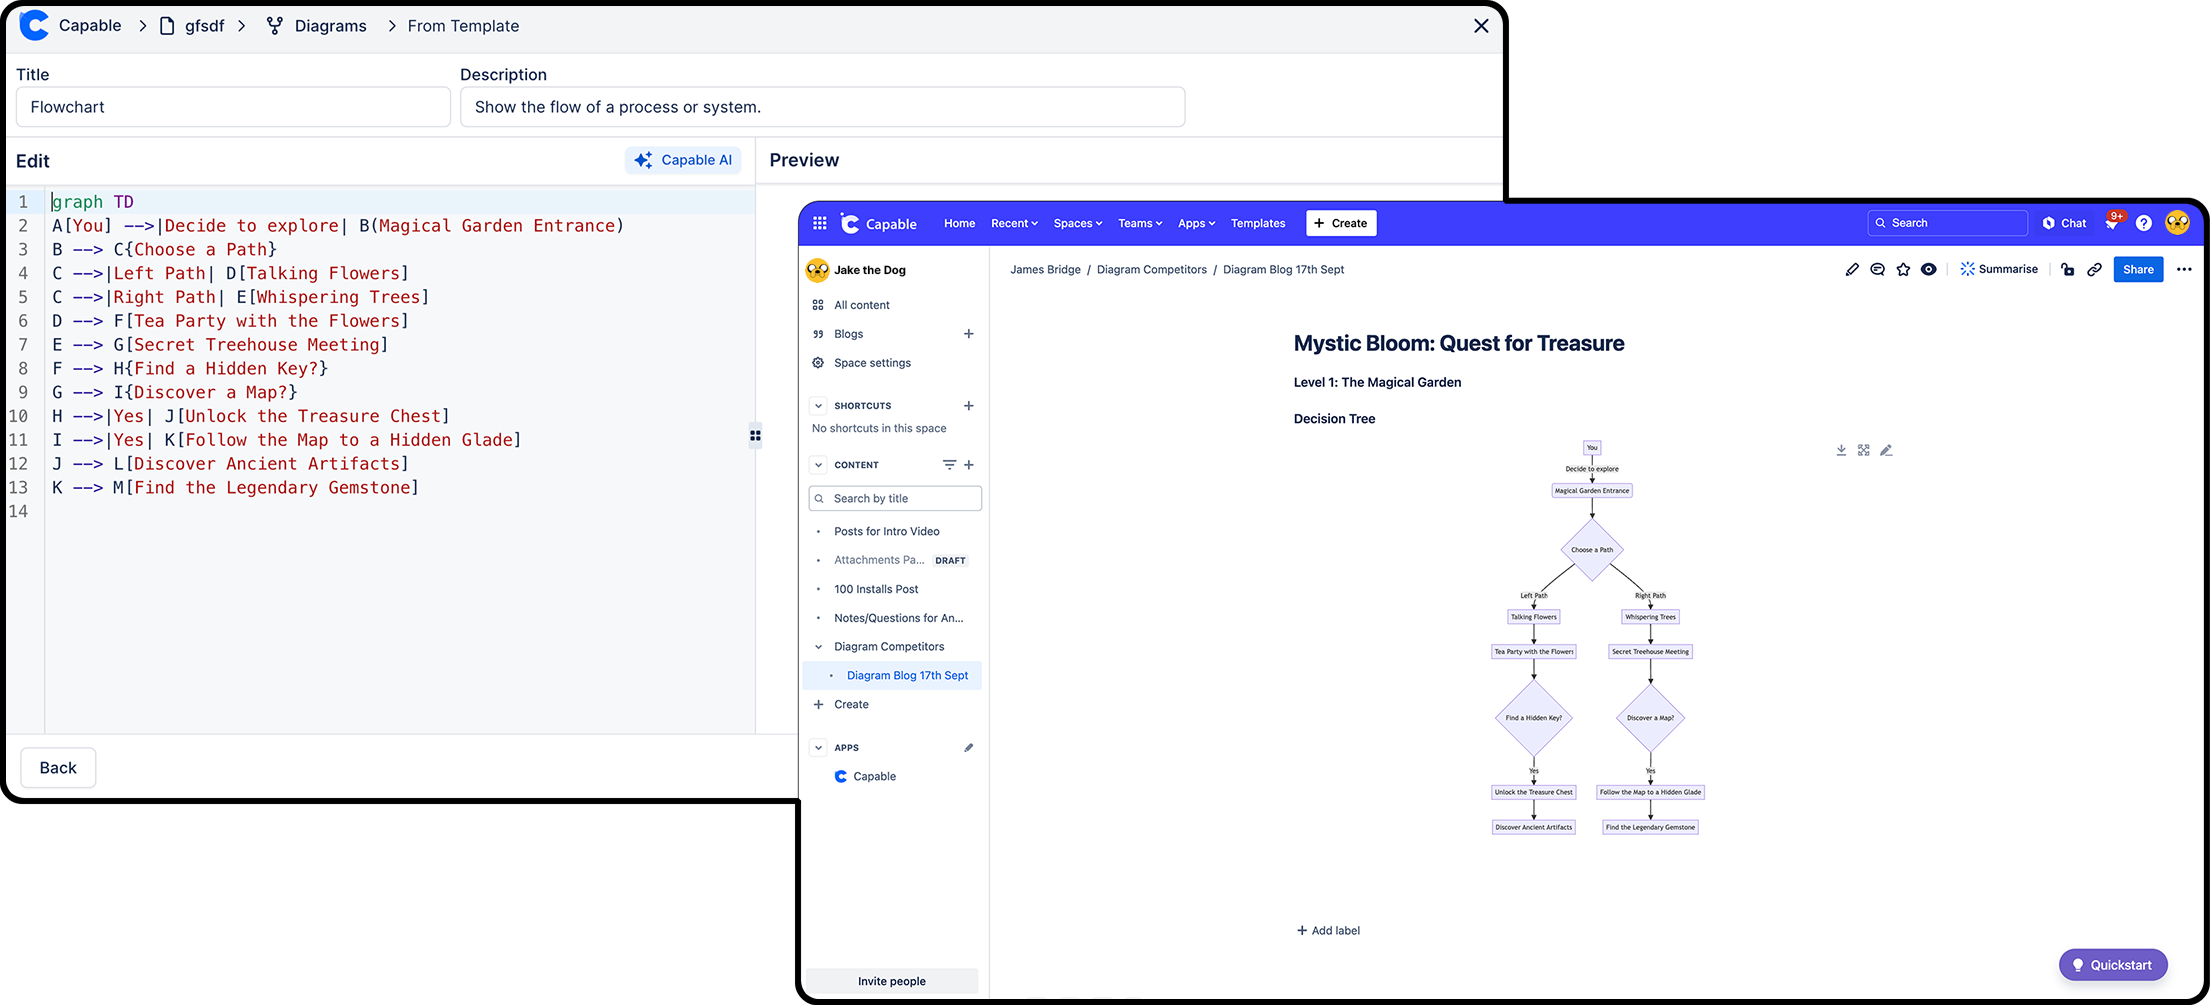
While the visual editor makes diagramming easier for everyone, we haven’t forgotten about our technical users. Our app still fully supports text-based diagrams in formats such as Mermaid, PlantUML, C4, Seqdiag, DBML, and TikZ. This means advanced users can still leverage the power of text to build and fine-tune complex diagrams and embed them directly into Confluence.
You can even mix and match approaches, creating some diagrams visually while coding others, all within the same Confluence page. Whether you’re building simple process flows or complex infrastructure maps, the app ensures that your Confluence pages remain versatile and fully customizable for all users.
Conclusion
Enhance your Confluence spaces today by creating real-time, interactive diagrams that bring clarity and visual impact to your content. Templates, icon libraries, and drag-and-drop functionality make it easy to create once and share across teams. Don’t miss out—explore the new visual editor and see how it transforms your Confluence experience!
%20copy.png)


